добрый день
как можно понять что именно нагружает систему?
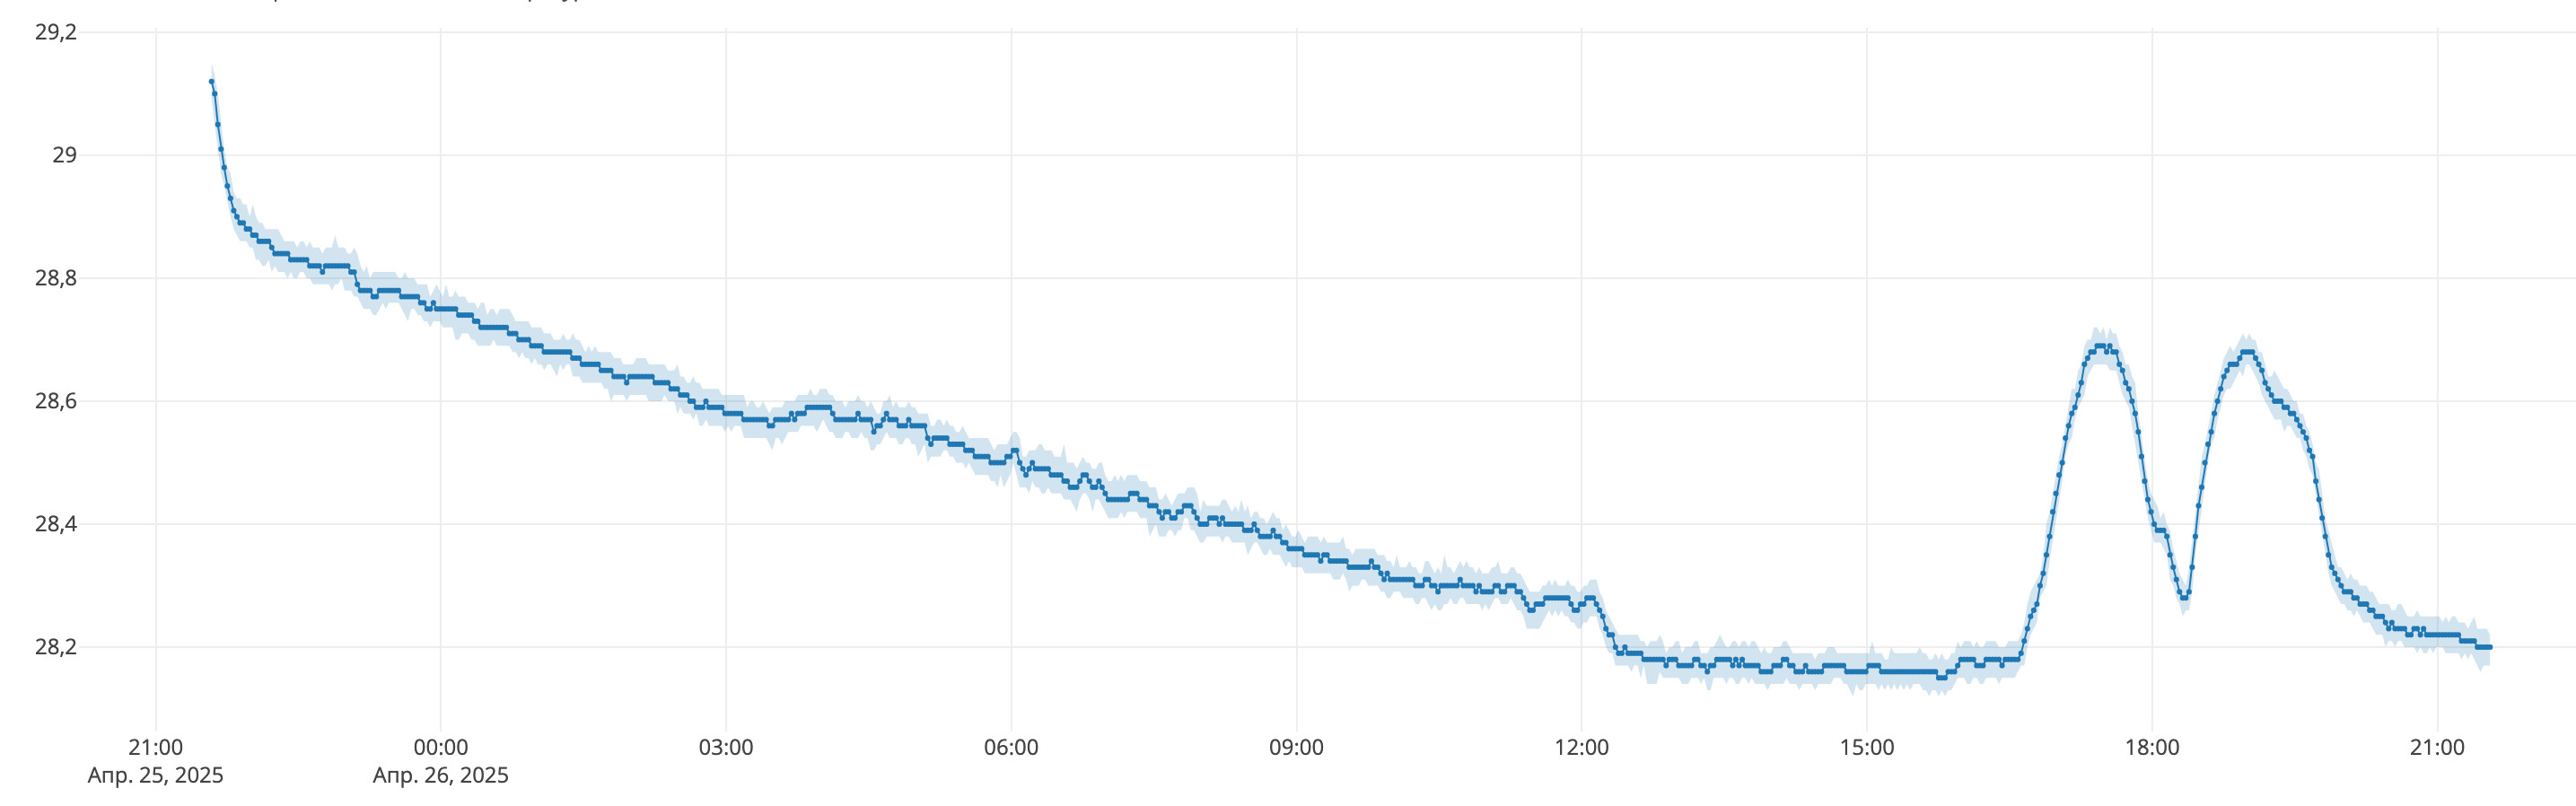
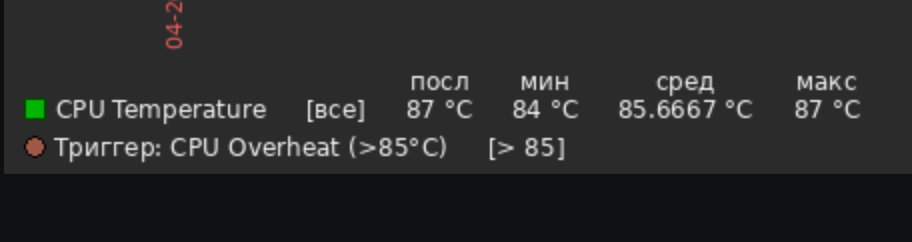
root@wirenboard-AAA4DILM:~# awk '{printf "CPU temperature: %.1f°C\n", $1/1000}' /sys/class/thermal/thermal_zone0/temp

CPU temperature: 86.9°C

root@wirenboard-AAA4DILM:~# awk '{printf "CPU temperature: %.1f°C\n", $1/1000}' /sys/class/thermal/thermal_zone0/temp

CPU temperature: 87.7°C

root@wirenboard-AAA4DILM:~# awk '{printf "CPU temperature: %.1f°C\n", $1/1000}' /sys/class/thermal/thermal_zone0/temp

CPU temperature: 84.2°C

root@wirenboard-AAA4DILM:~#
top - 23:17:30 up 18 min,  2 users,  load average: 3.32, 2.01, 1.36
Tasks: 168 total,   1 running, 167 sleeping,   0 stopped,   0 zombie
%Cpu(s): 12.1 us, 26.5 sy,  2.7 ni, 57.7 id,  0.1 wa,  0.0 hi,  1.0 si,  0.0 st
MiB Mem :   2013.0 total,   1270.4 free,    316.6 used,    426.0 buff/cache
MiB Swap:    256.0 total,    256.0 free,      0.0 used.   1633.6 avail Mem

  PID USER      PR  NI    VIRT    RES    SHR S  %CPU  %MEM     TIME+ COMMAND
 7519 root      20   0  146440  14552   7272 S  21.0   0.7   2:54.58 wb-mqtt-serial
  340 root      25   5  221080 103760  44116 S  11.8   5.0   2:48.55 node-red
 2161 root      20   0  846104  26948  17124 S  11.1   1.3   2:14.67 wb-rules
 2067 root      20   0   68644  11732   6304 S  10.2   0.6   1:46.66 main
 2005 mosquit+  20   0   13056   8572   4848 S   3.0   0.4   0:32.83 mosquitto
 1702 root      20   0   24944  12392   7600 S   2.3   0.6   0:34.85 python3
    7 root      20   0       0      0      0 I   2.0   0.0   0:13.78 kworker/u8:0-events_unbound
  505 root      20   0   64436  12932  10552 S   2.0   0.6   0:33.98 NetworkManager
 2106 root      20   0   32720  10696   5444 S   2.0   0.5   0:19.58 wb-mqtt-mbgate
  142 root      20   0   81220  34400  33532 S   1.6   1.7   0:19.39 systemd-journal
  306 message+  20   0    6464   3340   2564 S   1.6   0.2   0:28.65 dbus-daemon
 2120 root      20   0   30040  12968   6444 S   1.6   0.6   0:13.17 wb-metrics
10456 root      20   0       0      0      0 I   1.6   0.0   0:07.48